Practical Parallelization in C# with MapReduce, ProducerConsumer and ActorModel
The barrier of entry into multi-threading in .NET is relatively low as both Parallel Computing (making programs run faster) and Concurrent Programming (making programs more responsive) have been greatly simplified since the introduction of TPL and its friends (Parallel and PLINQ) in .NET4.0.
Despite this low barrier of entry, many developers fail to achieve the best performance out of their multi-threaded solutions. This is sometimes due to frequent or unnecessary locking/synchronization or at other times due to incorrectly partitioning their data or using an inappropriate pattern.
In this article we are going to look at how we can squeeze the best performance out of an easily parallelizable problem by rewriting the same basic implementation using some of the most widely used multi-threading tools available in .NET. We will be covering different .NET technologies such as PLINQ, BlockingCollection, Parallel class as well as TPL Dataflow in conjunction with patterns such as MapReduce, ActorModel as well as ProducerConsumer while trying to achieve optimal parallelization and minimize the cost of synchronization between the threads.
The Scenario
The example scenario we will be solving is to count the number of words in a text file which is the IMDB database for movie plots downloaded from HERE. The file (as of today) is 432MB with 8,151,603 lines consisting of 69,275,414 words and 432,045,742 characters. So our job is to figure out what the top n words and their respective counts are in this file. The overall work required to calculate the result can be summarized as:
- Read every line in the file
- Convert each line into words
- Exclude invalid words e.g. “a”, “and”, “with” etc.
- Count and track the occurrence of each word
- Sort the words from the highest count to the lowest
- Return the top n words e.g. 100
Our final result should display something like this:
life   128,714
new    119,587
man    96,257
time   89,828
world  88,863
young  87,279
film   82,800
love   80,002
family 75,530
home   74,265
story  73,211
old    62,433
day    62,319
finds  61,394
father 60,055
...
Approach
We will be measuring the following for each of the patterns we implement:
- The total execution time of the program
- The count of times Garbage Collection occurs across different generations i.e. 0, 1 and 2
- The process’s Peak Working Set memory which is the maximum amount of physical memory (RAM) used by the process.
In addition to the above, for each implementation I will also include a Time-Line profiling snapshot of the process using the awesome dotTrace profiler developed by JetBrains (available as a 10 day trial). This allows us to analyze the context under which our thread(s) were executing and the level of concurrency and CPU utilization we achieved for that implementation.
You can use other tools and profilers such as the Visual Studio Performance Profiling, ANTS Performance Profiler by RedGate or the Concurrency Visualizer extension for Visual Studio. There is also a free new comer built using C# and WPF called CodeTrack; It looks quite promising and I highly suggest taking a look and having a play.
In order to increase our application’s throughput, we will set the GC mode to Server. A Server GC mode results in less frequent GC across all generations but it also means that each CPU core will now have its own heap as well as a dedicated thread responsible for collecting every dead references in that heap so on my 24-core server we will have 24 threads dedicated to GC but that is not all, thanks to the Background Server GC which was introduced in .NET4.5 the number of threads can increase even more! This feature is used to offload a significant subset of the Gen-2 GC by using dedicated background threads resulting in a significant reduction of the total pause times on the user threads but remember, this only applies to Gen-2 as both Gen-0 and Gen-1 collections still require all user threads to be suspended.
Also remember that under Server GC, heap sizes are much larger compared to the Workstation GC so don’t be alarmed if you see large memory usage in our implementations.
Note:
In order to keep the focus of this article on the concurrency costs of each implementation rather than the behavior of GC, I have excluded all of the GC threads from our profiling results. This includes the Finalizer as well as the background GC threads. But to investigate how the GC performed for each of the algorithms, you can include all those threads in the snapshot file provided for each implementation (by installing & running dotTrace).
I will be running the application on a 24-core dual CPU workstation with 24GB of RAM and the input file is being read from a 7200 RPM HDD with 64MB of cache. Each pattern will be profiled individually and the Windows File Cache will be cleared between each run.
Finally, You can find the code HERE. Okay, now that we have all those covered, let’s get started!
1. Sequential
private static IDictionary<string, uint> GetTopWords()
{
    Dictionary<string, uint> result = new(StringComparer.InvariantCultureIgnoreCase);

    // process lines as IEnumerable<string> read one after another from the disk.
    foreach (var line in File.ReadLines(InputFile.FullName))
    {
        foreach (var word in line.Split(Separators, StringSplitOptions.RemoveEmptyEntries))
        {
            if (!IsValidWord(word)) { continue; }
            TrackWordsOccurrence(result, word);
        }
    }

    return result
        .OrderByDescending(kv => kv.Value)
        .Take((int)TopCount)
        .ToDictionary(kv => kv.Key, kv => kv.Value);
}

private static void TrackWordsOccurrence(IDictionary<string, uint> wordCounts, string word)
{
    if (wordCounts.TryGetValue(word, out uint count))
    {
        wordCounts[word] = count + 1;
    }
    else
    {
        wordCounts[word] = 1;
    }
}

private static bool IsValidWord(string word) =>
    !InvalidCharacters.Contains(word[0]) && !StopWords.Contains(word);
There is nothing complicated about this code, all we are doing here is reading a bunch of lines splitting them into words, doing some filtering and keeping track of each word in a Dictionary<string, uint>. We then order the result by the count of each word in descending order and return n entries from the result.
Running the above produces the following:
Execution time: 87,025 ms
Gen-0: 27, Gen-1: 10, Gen-2: 4
Peak WrkSet: 617,037,824
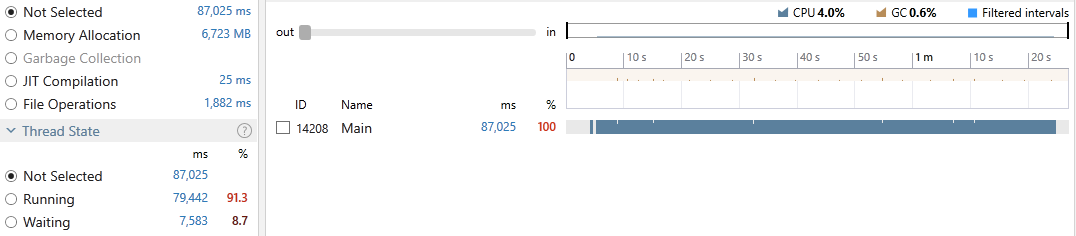
As we can see, the program achieved an average CPU utilization of 4.0%, took 87,025 milliseconds out of which 0.6% was spent on GC. 91.3% of the main thread time was in the Running state and 8.7% in Waiting. The process reached a peak memory of ~600MB. Since this implementation is a straight-forward single-threaded execution, there was no locking involved therefore no cost associated to locking-contention.
2. Sequential (LINQ)
Next, the same sequential algorithm implemented using LINQ:
private static IDictionary<string, uint> GetTopWords()
{
    return File.ReadLines(InputFile.FullName)
        .SelectMany(l => l.Split(Separators, StringSplitOptions.RemoveEmptyEntries))
        .Where(IsValidWord)
        .ToLookup(x => x, StringComparer.InvariantCultureIgnoreCase)
        .Select(x => new { Word = x.Key, Count = (uint)x.Count() })
        .OrderByDescending(kv => kv.Count)
        .Take((int)TopCount)
        .ToDictionary(kv => kv.Word, kv => kv.Count);
}
Here we are projecting each line into a sequence of words, filter out the invalid words and then group the words using ToLookup (or GroupBy) to get their count; finally we order them and take the top n items.
Here’s the result:
Execution time: 92,174 ms
Gen-0: 6, Gen-1: 4, Gen-2: 3
Peak WrkSet: 4,579,205,120
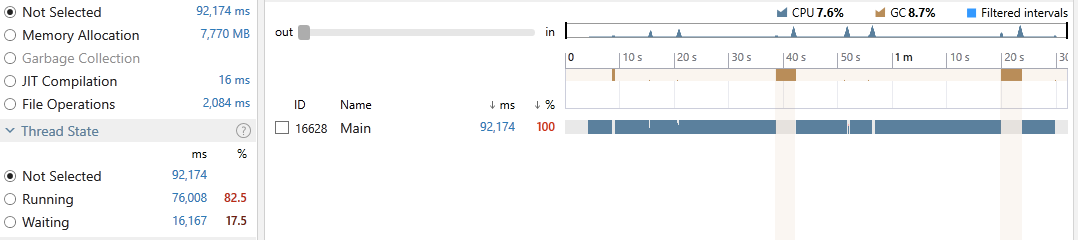
This time, the program achieved an average CPU utilization of 7.6%, took 92,174 milliseconds out of which 8.7% was spent on GC. 82.5% of all our threads time were in the Running state and 17.5% in Waiting. Exploring the snapshot file reveals that around 40% was used doing LINQ operations so there is no surprise to see the inferior performance (due to LINQ’s overhead). Just as above, there is no locking involved. Also note our process resulted in a whopping 4.6GB of peak memory.
3. PLINQ (Naive)
As the title suggests here we will build a hybrid of PLINQ and a single-threaded solution. The code is similar to the sequential LINQ with the addition of .AsParallel() which does all the magic!
The work relating to reading each line, projecting the words and filtering will be distributed across all the available system cores and the work relating to keeping track of each of the word’s occurrence is done on the main thread. In other words the main thread in our foreach loop pulls each line from the disk all the way through the PLINQ parallelized pipeline.
private static IDictionary<string, uint> GetTopWords()
{
    var words = File.ReadLines(InputFile.FullName)
        .AsParallel()
        .SelectMany(l => l.Split(Separators, StringSplitOptions.RemoveEmptyEntries))
        .Where(IsValidWord);

    Dictionary<string, uint> result = new(StringComparer.InvariantCultureIgnoreCase);
    foreach (var word in words)
    {
        TrackWordsOccurrence(result, word);
    }

    return result
        .OrderByDescending(kv => kv.Value)
        .Take((int)TopCount)
        .ToDictionary(kv => kv.Key, kv => kv.Value);
}
Running the above results in the following:
Execution time: 80,620 ms
Gen-0: 10, Gen-1: 7, Gen-2: 4
Peak WrkSet: 1,677,287,424
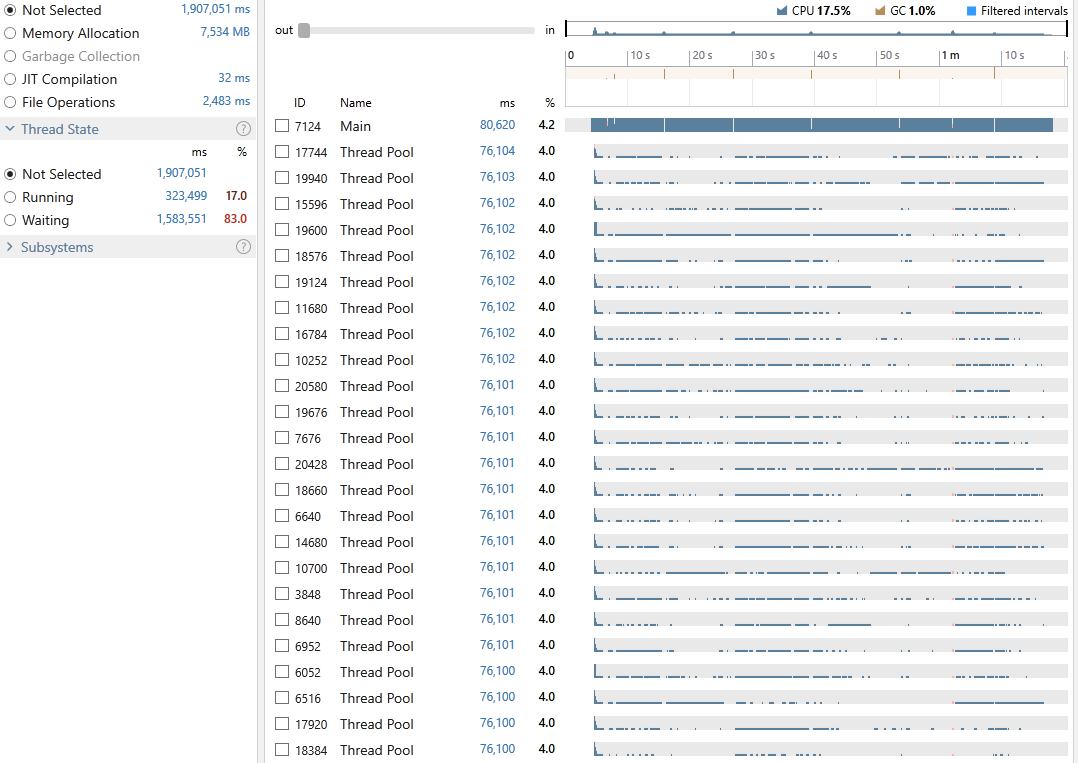
This time, the program achieved an average CPU utilization of 17.5%, took 80,620 milliseconds out of which 1.0% was spent on GC. 17% of all our threads time were in the Running state and 83% in Waiting. Exploring the snapshot file reveals that around 18% was spent doing LINQ operations there is also very little locking contention (0.07%) since the main part of the app which requires synchronization is actually running on the main thread. Also note our process resulted in a 1.7GB of peak memory.
Okay, so not much of an improvement but be ready as things are about to change!
A bit about Partitioning
Before continuing any further I feel I should mention an important aspect of PLINQ which is responsible for splitting and assigning each input element to a worker thread. This is known as Partitioning and there are currently four different partitioning strategies in TPL all of which are supported by PLINQ; These are:
- Chunk partitioning
- Range partitioning
- Hash partitioning
- Striped partitioning
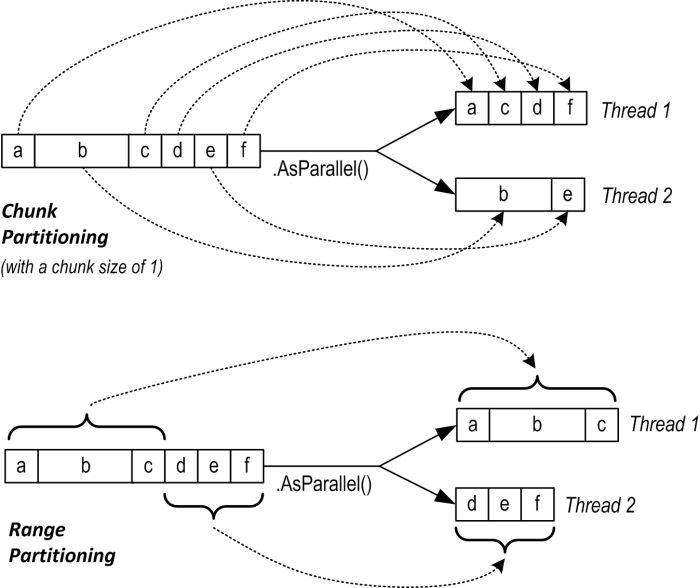
Chunk partitioning uses dynamic element allocation as opposed to static element allocation (which is used by both Range and Hash partitioning). Dynamic allocation allows partitions to be created on the fly as opposed to being allocated in advance which means that a dynamic partitioner needs to request elements more frequently from the input sequence resulting in more synchronization; In contrast, static partitioning allows elements to be assigned all at once which results in less overhead and no additional synchronization after the initial work required for creating the partitions. Note that Parallel.ForEach only supports dynamic partitioning (unless you implement one yourself).
PLINQ chooses Range partitioning for any sequence which can be indexed into i.e IList<T> (or ParallelEnumerable.Range) which usually results in a better performance unless the amount of processing required for each element is not constant. For example in a scenario where there is a non-uniform processing time (think of ray-tracing), threads can finish work on their assigned partitions early and sit there idle unable to process more items. For such scenarios with non-uniform processing times, Chunk partitioning may be a better strategy. It is possible to instruct PLINQ to choose Chunk partitioning for an indexable sequence by using Partitioner.Create(myArray, true).
Hash partitioning is used by query operators that require comparing elements (e.g. GroupBy, Join, GroupJoin, Intersect, Except, Union and Distinct). Hash partitioning can be inefficient in that it must precalculate the hashcode for each element (so that elements with identical codes are assigned and processed on the same thread).
Striped partitioning is the strategy used by SkipWhile and TakeWhile and is optimized for processing items at the head of a data source. In striped partitioning, each of the n worker threads is allocated a small number of items (sometimes 1) from each block of n items. The set of items belonging to a single thread is called a stripe, hence the name. A useful feature of this scheme is that there is no inter-thread synchronization required as each worker thread can determine its data via simple arithmetic. This is really a special case of range partitioning and only works on arrays and types that implement IList<T>.
Here is a diagram showing an overview of the most widely used Chunk and Range partitioning taken from Albahari’s must read Threading in C#.
For more details on Partitioning, I highly suggest having a look at Partitioning in PLINQ, Chunk partitioning vs range partitioning in PLINQ, Partitioning of Work and Custom Partitioners for PLINQ and TPL.
Okay, now that we know a little more about partitioning we can look at more PLINQ implementations.
4. PLINQ
This time we are going to let PLINQ do all the work by letting it partition the input sequence of lines (using Chunk partitioning) and see if we can do any better than what we have done so far.
private static IDictionary<string, uint> GetTopWords()
{
    return File.ReadLines(InputFile.FullName)
        .AsParallel()
        .SelectMany(l => l.Split(Separators, StringSplitOptions.RemoveEmptyEntries))
        .Where(IsValidWord)
        .ToLookup(x => x, StringComparer.InvariantCultureIgnoreCase)
        .AsParallel()
        .Select(x => new { Word = x.Key, Count = (uint)x.Count() })
        .OrderByDescending(kv => kv.Count)
        .Take((int)TopCount)
        .ToDictionary(kv => kv.Word, kv => kv.Count);
}
Running the above results in the following:
Execution time: 22,480 ms
Gen-0: 4, Gen-1: 2, Gen-2: 2
Peak WrkSet: 4,579,401,728
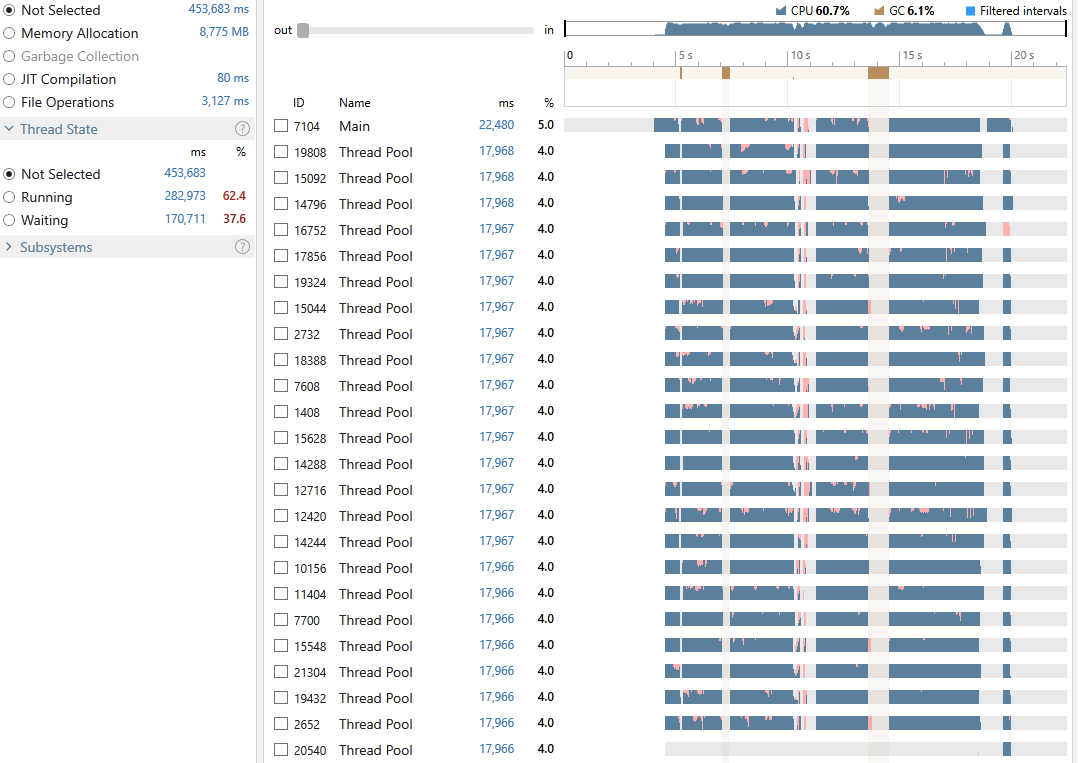
And just like that the program managed to achieve an average CPU utilization of 60.7%, took 22,480 milliseconds out of which 6.1% was spent on GC. 62.4% of all our threads time were in the Running state and 37.6% in Waiting. Exploring the snapshot file reveals that around 47% was spent executing LINQ operations and 14.5% on locking contention. Note the size of the WorkingSet is still at around 4.5GB.
Despite the great reduction in execution time we can still observe a substantial cost in locking contention. A large part of this cost is incurred during the grouping of the words (the step calling ToLookup(x => x, StringComparer.InvariantCultureIgnoreCase)).
5. PLINQ (MapReduce)
As we saw above, despite the simplicity and succinctness of the PLINQ implementation, we still incurred a high cost of locking so now we will use a different flavour of PLINQ which allows us to perform MapReduce. We are going to have a map phase where our problem can be split into smaller independent steps which can then be executed on any thread without the need for synchronization.
Each worker thread will then do the work of splitting the lines and excluding the invalid words and when the time comes to group them all back together, each thread will then merge reduce the result by locking over the shared collection which will happen per partition.
Let us see how this can be implemented using the Aggregate method in PLINQ:
private static IDictionary<string, uint> GetTopWords()
{
    return File.ReadLines(InputFile.FullName)
        .AsParallel()
        .Aggregate(
/*#1*/      () => new Dictionary<string, uint>(StringComparer.InvariantCultureIgnoreCase),
/*#2*/      (localDic, line) =>
            {
                foreach (var word in line.Split(Separators, StringSplitOptions.RemoveEmptyEntries))
                {
                    if (!IsValidWord(word)) { continue; }
                    TrackWordsOccurrence(localDic, word);
                }
                return localDic;
            },
/*#3*/      (finalResult, localDic) =>
            {
                foreach (var pair in localDic)
                {
                    var key = pair.Key;
                    if (finalResult.ContainsKey(key))
                    {
                        finalResult[key] += pair.Value;
                    }
                    else
                    {
                        finalResult[key] = pair.Value;
                    }
                }
                return finalResult;
            },
/*#4*/      finalResult => finalResult
                .OrderByDescending(kv => kv.Value)
                .Take((int)TopCount)
                .ToDictionary(kv => kv.Key, kv => kv.Value)
        );
}
Still confusing? Here are the main steps again:
-
Step #1: First we supply a
Dictionary<string, uint>for each of the threads running our code so this means every thread will have a local collection to work with, eliminating the need for locking. -
Step #2: Here we have the main logic which will be executed by each thread for every line in our file, the scary looking
Func<Dictionary<string, uint>, string, Dictionary<string, uint>>allows the dictionary declared at step #1 to be passed aslocalDicalong with the line read from the disk to the body of the delegate. After the thread is done adding the words to the dictionary it will return thelocalDicso that it can be available to the same thread operating on the next line in the same partition. -
Step #3: Once every thread has finished processing all the items in its partition then all the items on its local dictionary is then merged (reduced) into a final result-set. Hence, the delegate is of type
Func<Dictionary<string, uint>, Dictionary<string, uint>>. By this step our MapReduce implementation is actually complete however theAggregatemethod offers us one final step. -
Step #4: This is where you have the chance to do any modification to the final result before returning it. In our case we are doing a simple ordering followed by a
Takeand projection back into a dictionary.
So let us see how we did this time:
Execution time: 21,915 ms
Gen-0: 12, Gen-1: 5, Gen-2: 3
Peak WrkSet: 1,082,503,168
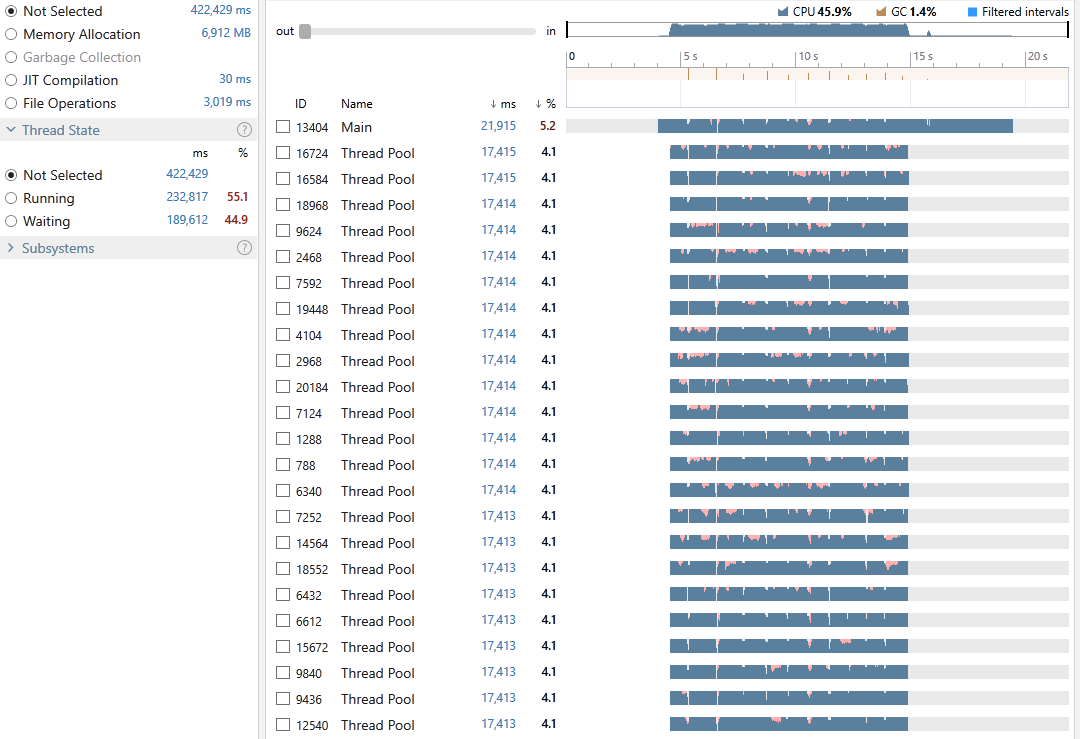
This time the program achieved an average CPU utilization of 45.9%, it took 21,915 milliseconds out of which only 1.4% was spent on GC. 55.1% of all our threads time were in the Running state and 44.9% in Waiting. So despite the lower CPU utilization in comparison to the previous step the lower time in GC did actually improve the overall execution time. Exploring the snapshot file reveals that around 37% was spent executing LINQ operations and 6.9% on locking contention. You can also see that our peak memory usage was 4x smaller than the previous method. So while we may not have improved the execution time significantly we have managed to achieve more by using less CPU as well as a much lower memory footprint.
Not too shabby ha! :-)
6. PLINQ (ConcurrentDictionary)
PLINQ’s biggest advantage/convenience is thanks to its ability to collate the result of the parallelized work into a single output sequence and that is indeed what we have used until now. For this pattern we are going to do things a bit differently; First, we are not going to use PLINQ’s result collation. Instead, we are going to give it a function and tell it to run multiple threads each applying that function to our data. The method allowing us to achieve this is ForAll. That was the first part, now for the second part we are going to choose a different data type for tracking the count of words.
Sometimes choosing the right datatype (in our case collection), can make all the difference. There is no better example to demonstrate this than what we will see in this section. We are going to pick the ConcurrentDictionary as our collection and let it handle all the synchronization for us.
private static IDictionary<string, uint> GetTopWords()
{
    ConcurrentDictionary<string, uint> result = new(StringComparer.InvariantCultureIgnoreCase);

    File.ReadLines(InputFile.FullName)
        .AsParallel()
        .ForAll(line =>
        {
            foreach (var word in line.Split(Separators, StringSplitOptions.RemoveEmptyEntries))
            {
                if (!IsValidWord(word)) { continue; }
                result.AddOrUpdate(word, 1, (key, oldVal) => oldVal + 1);
            }
        });

    return result
        .OrderByDescending(kv => kv.Value)
        .Take((int)TopCount)
        .ToDictionary(kv => kv.Key, kv => kv.Value);
}
There is not much to the code except the use of AddOrUpdate. Each thread is using this method to Add a given word with a count of 1, if the word was already added, it then takes the value (count) of that word and adds 1 to it. All of this is done in a thread-safe manner and any synchronization is handled by the ConcurrentDictionary. Okay, how did we do this time?
Execution time: 19,229 ms
Gen-0: 16, Gen-1: 8, Gen-2: 4
Peak WrkSet: 863,531,008
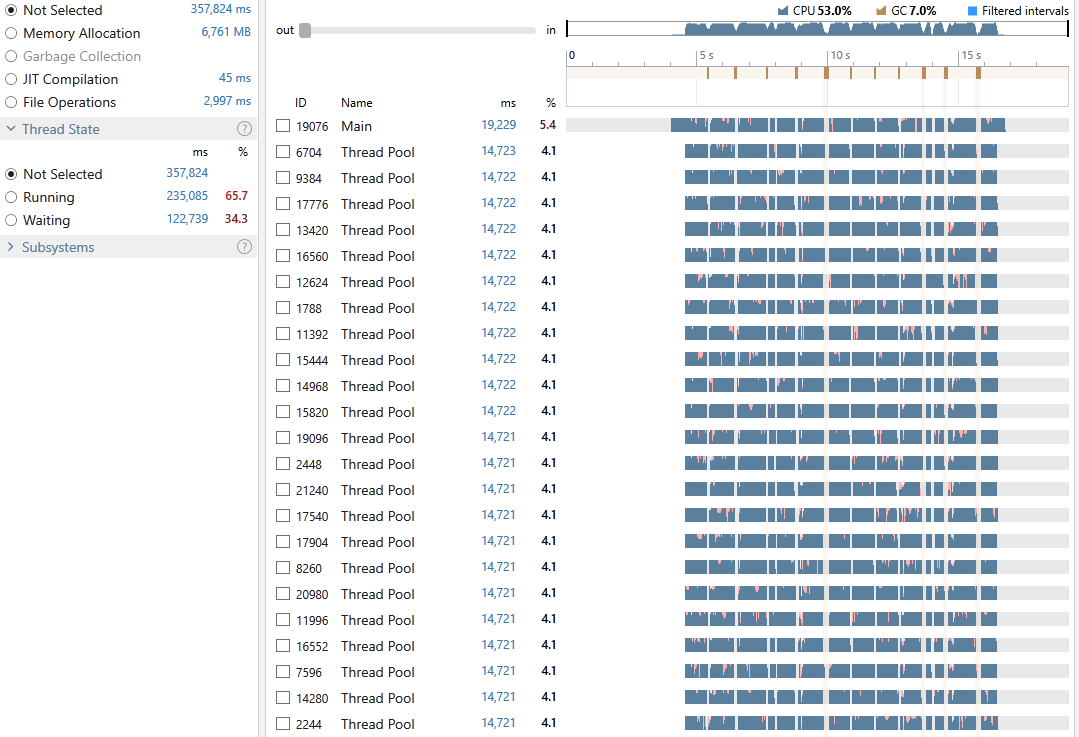
This time the program achieved an average CPU utilization of 53%, it took 19,229 milliseconds out of which only 7% was spent on GC. 65.7% of all our threads time were in the Running state and 34.3% in Waiting. Exploring the snapshot file reveals that around 33% was spent executing LINQ operations and 10.3% in locking.
7. PLINQ (ProducerConsumer)
In this final section of using PLINQ to achieve parallelism, we are going to cover my favorite pattern which I frequently use to deal with problems where I have one or more producers producing data and one or more workers consuming them.
For this algorithm, we have a single producer reading and adding (producing) the lines into some sort of a collection. We then have a bunch of consumers taking (consuming) and processing each line. The collection which allows such dance between the producer and its consumers is called the BlockingCollection<T> which by default is very similar to a [ConcurrentQueue
As far as PLINQ is concerned we are telling it to use at most 12 threads and also to not buffer the input so that as soon as the publisher adds a line, PLINQ can pass that to one of its 12 consumers and through the rest of the pipeline.
private static IDictionary<string, uint> GetTopWords()
{
    const int WorkerCount = 12;
    const int BoundedCapacity = 10_000;
    ConcurrentDictionary<string, uint> result = new(StringComparer.InvariantCultureIgnoreCase);

    // Setup the queue
    BlockingCollection<string> blockingCollection = new(BoundedCapacity);

    // Declare the worker
    Action<string> work = line =>
    {
        foreach (var word in line.Split(Separators, StringSplitOptions.RemoveEmptyEntries))
        {
            if (!IsValidWord(word)) { continue; }
            result.AddOrUpdate(word, 1, (key, oldVal) => oldVal + 1);
        }
    };

    Task.Run(() =>
    {
        // Begin producing
        foreach (var line in File.ReadLines(InputFile.FullName))
        {
            blockingCollection.Add(line);
        }
        blockingCollection.CompleteAdding();
    });

    // Start consuming
    blockingCollection
        .GetConsumingEnumerable()
        .AsParallel()
        .WithDegreeOfParallelism(WorkerCount)
        .WithMergeOptions(ParallelMergeOptions.NotBuffered)
        .ForAll(work);

    return result
        .OrderByDescending(kv => kv.Value)
        .Take((int)TopCount)
        .ToDictionary(kv => kv.Key, kv => kv.Value);
}
With the output of:
Execution time: 18,858 ms
Gen-0: 16, Gen-1: 9, Gen-2: 4
Peak WrkSet: 857,141,248
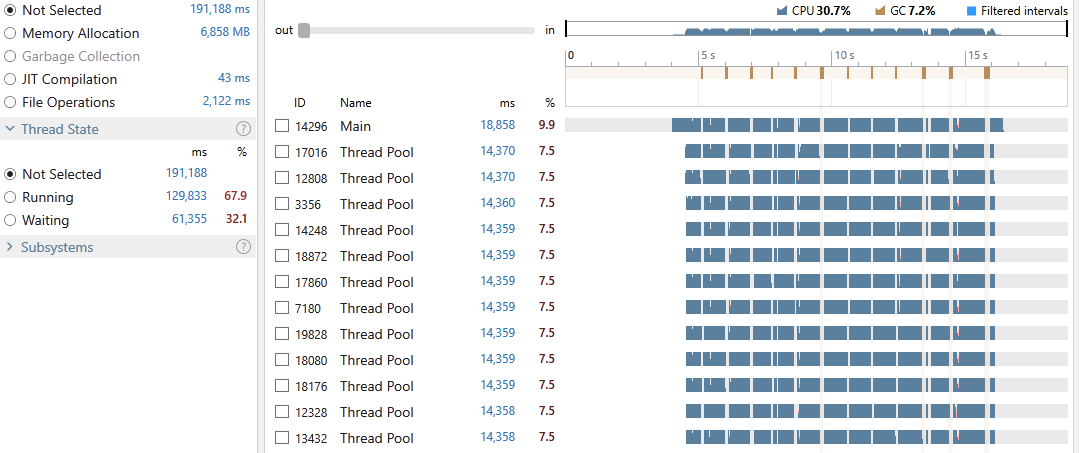
This time the program achieved an average CPU utilization of 30.7%, it took 18,858 milliseconds out of which only 7.2% was spent on GC. 67.9% of all our threads time were in the Running state and 32.1% in Waiting. Exploring the snapshot file reveals that around 15% was spent executing LINQ operations and 2.2% in locking contention.
As you can see, we managed to achieve very good concurrency by only using half of our cores and reduced the overall Waiting time and locking cost.
I cannot think of any other ways to squeeze any more performance juice out of PLINQ; (I am happy to be challenged by anyone on this, let me know in the comments) therefore, we are now going to start playing with the Parallel class.
8. Parallel.ForEach (MapReduce)
The Parallel class has a bunch of methods for us to use but the one we are interested in is the Parallel.ForEach. In it’s simplest form it accepts an IEnumerable<T> and an Action<T> which it then invokes in parallel for every item in the collection. Using this method however is not suitable for our use-case as we would need to synchronize access to our dictionary responsible for tracking the occurrence of each word therefore diminishing any benefits of parallelization. Instead, we are going to use the overload of the method which enables us to implement MapReduce. Here’s the code:
private static IDictionary<string, uint> GetTopWords()
{
    Dictionary<string, uint> result = new (StringComparer.InvariantCultureIgnoreCase);
    Parallel.ForEach(
        File.ReadLines(InputFile.FullName),
        new ParallelOptions { MaxDegreeOfParallelism = Environment.ProcessorCount },
        () => new Dictionary<string, uint>(StringComparer.InvariantCultureIgnoreCase),
        (line, state, index, localDic) =>
        {
            foreach (var word in line.Split(Separators, StringSplitOptions.RemoveEmptyEntries))
            {
                if (!IsValidWord(word)) { continue; }
                TrackWordsOccurrence(localDic, word);
            }
            return localDic;
        },
        localDic =>
        {
            lock (result)
            {
                foreach (var pair in localDic)
                {
                    var key = pair.Key;
                    if (result.ContainsKey(key))
                    {
                        result[key] += pair.Value;
                    }
                    else
                    {
                        result[key] = pair.Value;
                    }
                }
            }
        }
    );

    return result
        .OrderByDescending(kv => kv.Value)
        .Take((int)TopCount)
        .ToDictionary(kv => kv.Key, kv => kv.Value);
}
The implementation is very similar to the MapReduce we implemented using PLINQ and as you saw before, the main idea behind this pattern is to ensure each thread has it’s local data to work with and then when all the threads have processed all their items they will then merge (reduce) their results into a single sequence therefore greatly reducing synchronization.
Here is what this implementation gets us:
Execution time: 19,606 ms
Gen-0: 23, Gen-1: 13, Gen-2: 7
Peak WrkSet: 942,002,176
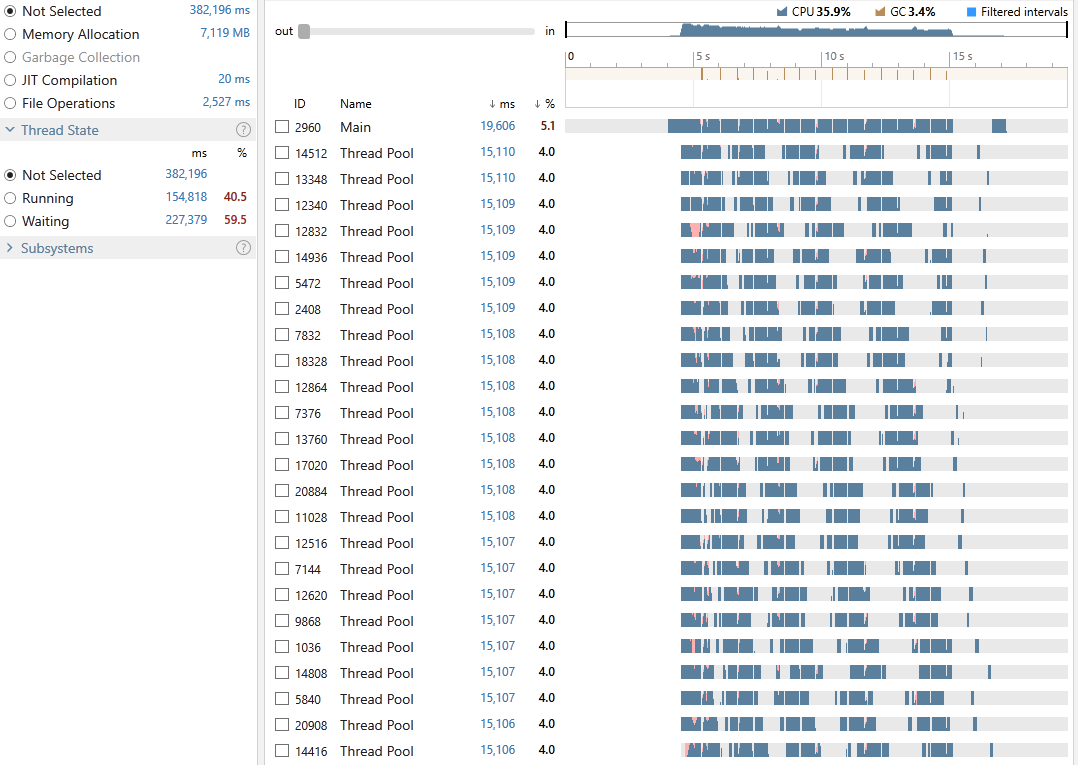
Okay, not bad. We have an average CPU utilization of 35.9%, an execution time of 19,606 milliseconds out of which 3.4% was spent on GC. 40.5% of all our threads time were in the Running state and 59.5% in Waiting. Looking at the snapshot we can see that the cost of locking contention is a whopping 35%, why? This is mainly due to the Chunk Partitioning if we were using Range Partitioning, we would only need to lock over the result once per thread at the end of its partition but for that we would need to load all the lines into an indexable collection such as an Array or an IList which would be fine if you had all the available RAM. In our case however, I was happy to pay the cost of having to lock more frequently (due to much smaller chunks).
9. Parallel.ForEach (ConcurrentDictionary)
In this section we are going to again use the ConcurrentDictionary and see what it gets us when used with Parallel.ForEach.
private static IDictionary<string, uint> GetTopWords()
{
    ConcurrentDictionary<string, uint> result = new(StringComparer.InvariantCultureIgnoreCase);
    Parallel.ForEach(
        File.ReadLines(InputFile.FullName),
        new ParallelOptions { MaxDegreeOfParallelism = Environment.ProcessorCount },
        (line, state, index) =>
        {
            foreach (var word in line.Split(Separators, StringSplitOptions.RemoveEmptyEntries))
            {
                if (!IsValidWord(word)) { continue; }
                result.AddOrUpdate(word, 1, (key, oldVal) => oldVal + 1);
            }
        }
    );

    return result
        .OrderByDescending(kv => kv.Value)
        .Take((int)TopCount)
        .ToDictionary(kv => kv.Key, kv => kv.Value);
}
Which outputs:
Execution time: 19,622 ms
Gen-0: 13, Gen-1: 6, Gen-2: 3
Peak WrkSet: 853,209,088
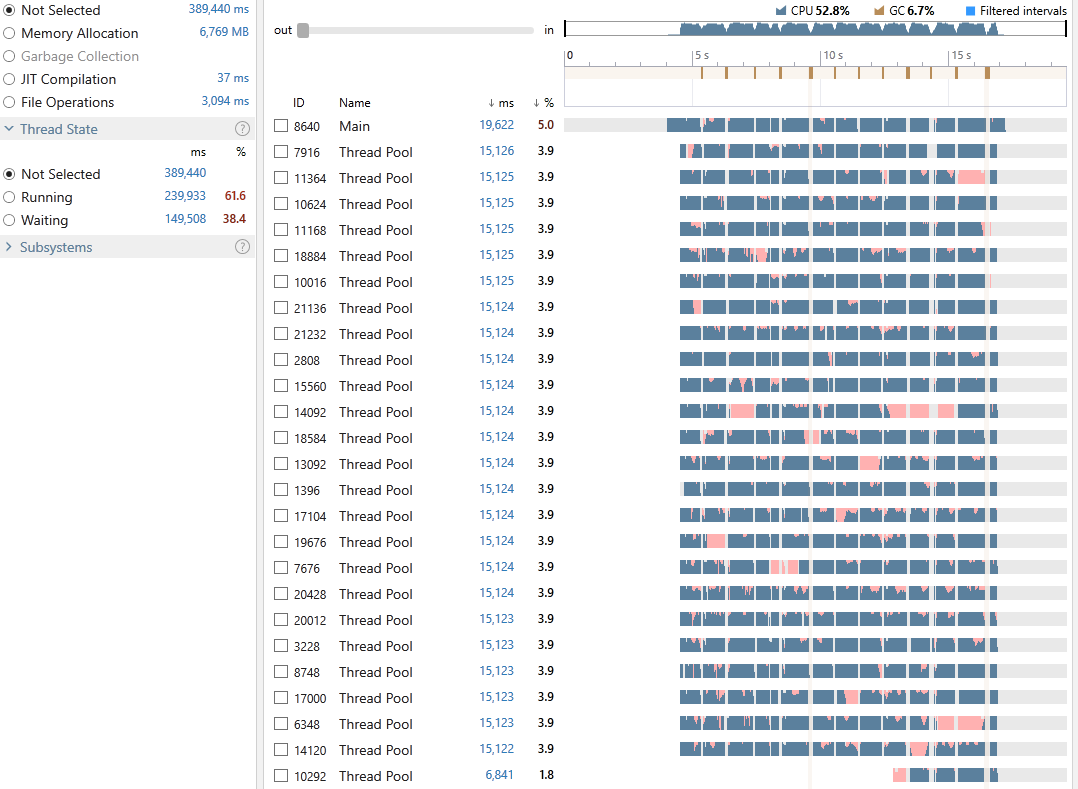
I don’t know about you but I quite like the ConcurrentDictionary! We have an average CPU utilization of 52.8%, an execution time of 19,622 milliseconds out of which 6.7% was spent on GC. 61.6% of all our threads time were in the Running state and 38.4% in Waiting. Looking at the snapshot reveals the cost of locking contention to be 9.4%.
Despite the great result we can see from the profiling graph that we have over loaded the CPU. How can I tell? Well each of those pink sections on the graph is showing us the time intervals where the thread is ready to run on the next available CPU core; Therefore, long ready intervals (the time the thread is waiting so that it can switch its state from Waiting to Running) can mean thread starvation and CPU overload. To address it, we can try reducing the number of threads by playing with the MaxDegreeOfParallelism. So remember that CPU overloading/thread starvation can and will hurt the performance.
10. ProducerConsumer with Tasks
We talked about the ProducerConsumer pattern in the PLINQ section, what we are doing here is pretty much identical to what we did before except we are going to use Tasks to execute our consumers.
Note the most important thing to remember about this pattern is that once the worker threads finish processing each item they get from the queue, they will stay blocked waiting for more items until the queue is marked as complete. So depending on the size of your input, you need to make sure that when you are assigning worker threads using Tasks, you mark them with the [TaskCreationOptions.LongRunning])(https://msdn.microsoft.com/en-us/library/system.threading.tasks.taskcreationoptions(v=vs.110).aspx) flag otherwise the Hill Climbing aka Thread Injection algorithm employed by TPL thinks that threads in the ThreadPool are blocked so in order to prevent against dead-locks, it kicks in and inject extra threads to the ThreadPool at a rate of one thread every 500 milliseconds which is not what we want. By using this flag you are telling TPL to spin up a dedicated thread for each of your workers/consumers.
private static IDictionary<string, uint> GetTopWords()
{
    const int WorkerCount = 12;
    const int BoundedCapacity = 10_000;
    ConcurrentDictionary<string, uint> result = new(StringComparer.InvariantCultureIgnoreCase);

    // Setup the queue
    BlockingCollection<string> blockingCollection = new(BoundedCapacity);

    // Declare the worker
    Action work = () =>
    {
        foreach (var line in blockingCollection.GetConsumingEnumerable())
        {
            foreach (var word in line.Split(Separators, StringSplitOptions.RemoveEmptyEntries))
            {
                if (!IsValidWord(word)) { continue; }
                result.AddOrUpdate(word, 1, (key, oldVal) => oldVal + 1);
            }
        }
    };

    // Start the workers
    var tasks = Enumerable.Range(1, WorkerCount)
        .Select(n =>
            Task.Factory.StartNew(
                work,
                CancellationToken.None,
                TaskCreationOptions.LongRunning,
                TaskScheduler.Default))
        .ToArray();

    // Begin producing
    foreach (var line in File.ReadLines(InputFile.FullName))
    {
        blockingCollection.Add(line);
    }
    blockingCollection.CompleteAdding();
    // End of producing

    // Wait for workers to finish their work
    Task.WaitAll(tasks);

    return result
        .OrderByDescending(kv => kv.Value)
        .Take((int)TopCount)
        .ToDictionary(kv => kv.Key, kv => kv.Value);
}
Which outputs:
Execution time: 31,979 ms
Gen-0: 15, Gen-1: 8, Gen-2: 4
Peak WrkSet: 935,489,536
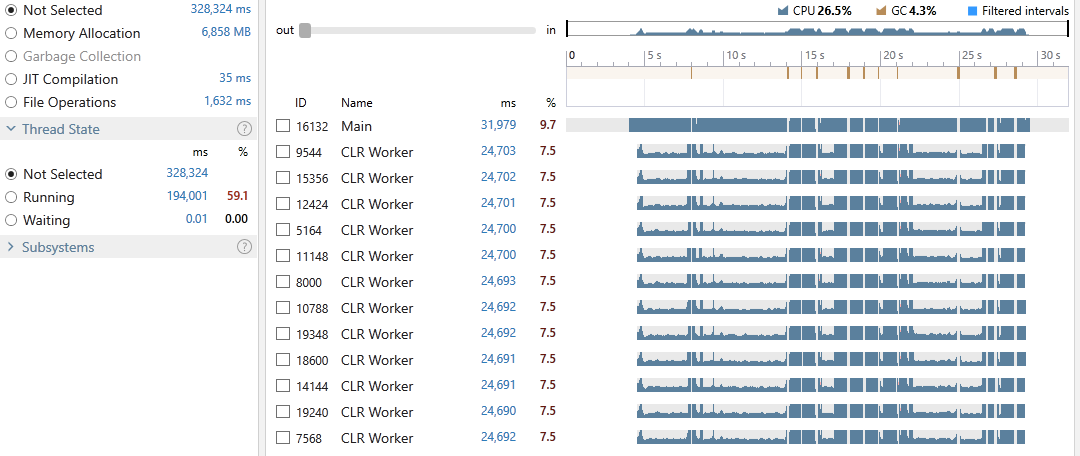
We have an average CPU utilization of 26.5%, an execution time of 31,979 milliseconds out of which 4.3% was spent on GC. 59.1% of all our threads time were in the Running state and 40.9% in Waiting. Looking at the snapshot we can see that cost of locking contention was at 2%.
11. ProducerConsumer with Tasks (Easier)
As I mentioned before, I use this pattern regularly therefore, over the years I have built an opinionated wrapper around it to reduce boiler plate as well as providing easy exception handling and control over the producers and consumers. It can also be used as a single-thread worker (sequencer) which is another pattern of its own that I may write about in another article. It is part of my Easy.Common library available on NuGet. So let us implement what we did in the previous section by using the ProducerConsumerQueue.
private static IDictionary<string, uint> GetTopWords()
{
    const int WorkerCount = 12;
    const int BoundedCapacity = 10_000;
    ConcurrentDictionary<string, uint> result = new(StringComparer.InvariantCultureIgnoreCase);

    // Declare the worker
    Action<string> work = line =>
    {
        foreach (var word in line.Split(Separators, StringSplitOptions.RemoveEmptyEntries))
        {
            if (!IsValidWord(word)) { continue; }
            result.AddOrUpdate(word, 1, (key, oldVal) => oldVal + 1);
        }
    };

    // Setup the queue
    ProducerConsumerQueue<string> pcq = new(work, WorkerCount, BoundedCapacity);
    pcq.OnException += (sender, ex) => Console.WriteLine("Oooops: " + ex.Message);

    // Begin producing
    foreach (var line in File.ReadLines(InputFile.FullName))
    {
        pcq.Add(line);
    }
    pcq.CompleteAdding();
    // End of producing

    // Wait for workers to finish their work
    pcq.Completion.Wait();

    return result
        .OrderByDescending(kv => kv.Value)
        .Take((int)TopCount)
        .ToDictionary(kv => kv.Key, kv => kv.Value);
}
With the following output:
Execution time: 39,124 ms
Gen-0: 14, Gen-1: 7, Gen-2: 4
Peak WrkSet: 934,985,728
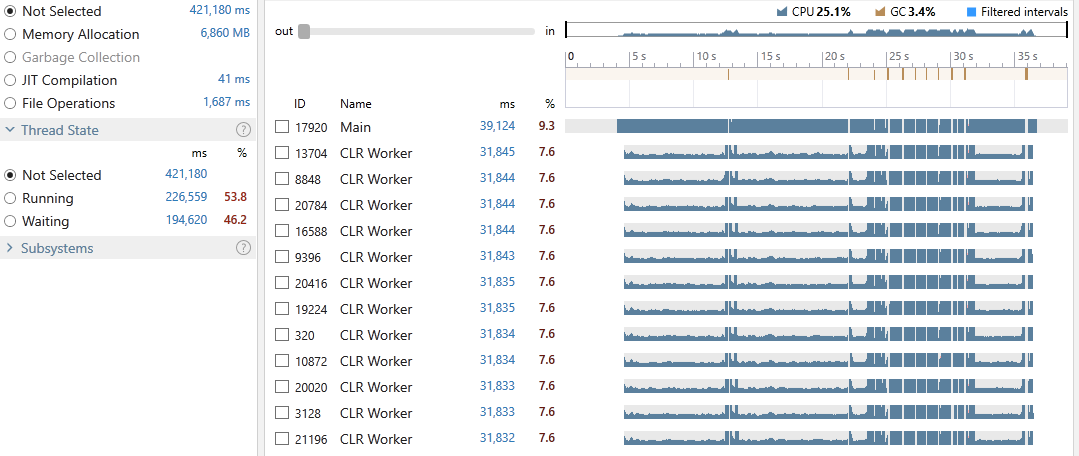
We have an average CPU utilization of 25.1%, an execution time of 39,124 milliseconds out of which 3.4% was spent on GC. 53.8% of all our threads time were in the Running state and 46.2% in Waiting. The snapshot shows the cost of locking contention as 2%.
12. TPL Dataflow
Finally and for the sake of completion we are going to implement the same solution using TPL Dataflow which provides a pipeline based execution and is great for implementing ActorModel scenarios as it provides (among other things) message passing. I am not going to focus much on Dataflow or ActorModel as there is a lot to cover.
We are going to start by creating the bufferBlock to which we push our lines, the block is then linked to splitLineToWordsBlock which as its name suggests is responsible for turning our lines into words. The splitLineToWordsBlock itself is linked to the batchWordsBlock which batches up our words into arrays of length 5000. Finally, each batch is then fed through the trackWordsOccurrencBlock which tracks the occurrence of each word.
Once we have all our blocks linked together, all we have to do is read our lines and feed them through the bufferBlock; When we are done pushing all the lines, we mark the bufferBlock as complete and wait for the trackWordsOccurrencBlock to finish consuming all its batches. Finally, just like the previous steps we order the result and return the top n entries.
private static IDictionary<string, uint> GetTopWords()
{
    const int WorkerCount = 12;
    ConcurrentDictionary<string, uint> result = new(StringComparer.InvariantCultureIgnoreCase);
    const int BoundedCapacity = 10_000;

    BufferBlock<string> bufferBlock = new(new DataflowBlockOptions { BoundedCapacity = BoundedCapacity });

    TransformManyBlock<string, string> splitLineToWordsBlock = new(
        line => line.Split(Separators, StringSplitOptions.RemoveEmptyEntries),
        new ExecutionDataflowBlockOptions
        {
            MaxDegreeOfParallelism = 1,
            BoundedCapacity = BoundedCapacity
        });

    BatchBlock<string> batchWordsBlock = new(5_000);

    ActionBlock<string[]> trackWordsOccurrencBlock = new(words =>
        {
            foreach (var word in words)
            {
                if (!IsValidWord(word)) { continue; }
                result.AddOrUpdate(word, 1, (key, oldVal) => oldVal + 1);
            }
        },
        new ExecutionDataflowBlockOptions { MaxDegreeOfParallelism = WorkerCount });

    DataflowLinkOptions defaultLinkOptions = new () { PropagateCompletion = true };
    bufferBlock.LinkTo(splitLineToWordsBlock, defaultLinkOptions);
    splitLineToWordsBlock.LinkTo(batchWordsBlock, defaultLinkOptions);
    batchWordsBlock.LinkTo(trackWordsOccurrencBlock, defaultLinkOptions);

    // Begin producing
    foreach (var line in File.ReadLines(InputFile.FullName))
    {
        bufferBlock.SendAsync(line).Wait();
    }

    bufferBlock.Complete();
    // End of producing

    // Wait for workers to finish their work
    trackWordsOccurrencBlock.Completion.Wait();

    return result
        .OrderByDescending(kv => kv.Value)
        .Take((int)TopCount)
        .ToDictionary(kv => kv.Key, kv => kv.Value);
}
Which outputs:
Execution time: 31,447 ms
Gen-0: 18, Gen-1: 10, Gen-2: 4
Peak WrkSet: 868,356,096
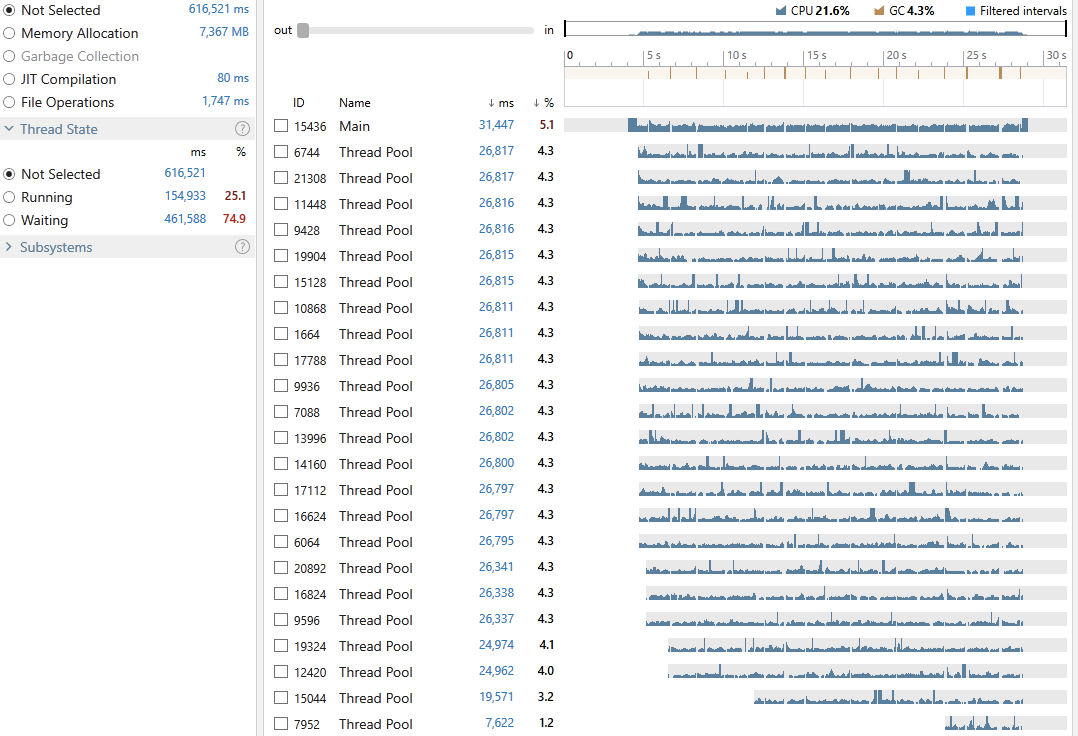
We have an average CPU utilization of 21.6%, an execution time of 31,447 milliseconds out of which 4.3% was spent on GC. 25.1% of all our threads time were in the Running state and 74.9% in Waiting. Looking at the snapshot we can see the cost of locking contention was at 0.01% which is not surprising as our entire processing was pipelined.
Conclusion
Here is a quick a summary of what each implementation achieved:
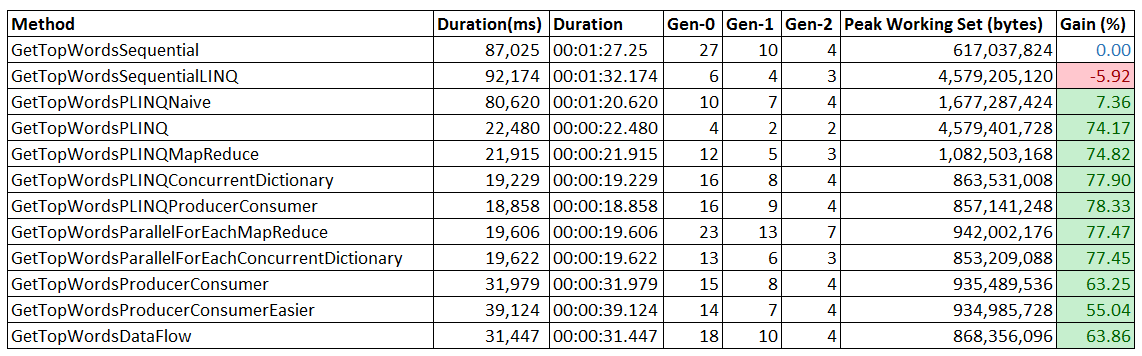
We saw that both the Parallel class and PLINQ can efficiently partition tasks and execute them across all the available cores in our system. We also learned how choosing a different data type, library or even different overloads of the same library can help us achieve better performance and CPU utilization.
We then looked at some of the other approaches to achieving parallelism mainly ProducerConsumer and ActorModel which may not have necessarily performed well for our DataParallelism scenario but can be suitable for TaskParallelism problems you may face in the future.
Finally, in order to help you choose between PLINQ and Parallel, I would like to mention an important difference between the two which goes back to how they were designed.
Parallel uses a concept referred to as Replicating Tasks which means a loop will start with one task for processing the loop body and if more threads are freed up to assist with the processing, additional tasks will be created to run on those threads which minimizes resource consumption in scenarios where most of the threads in the ThreadPool are busy doing other work. PLINQ on the other hand requires that a specific number of threads are actively involved for the query to make progress. This difference in design is the reason why there are ParallelOptions.MaxDegreeOfParallelism & PLINQ’s WithDegreeOfParallelism.
I hope you enjoyed reading this article as much as I enjoyed writing it and I invite you to share the patterns and techniques that you use for multi-threading and parallelism in the comments section below.
Have fun and let’s: